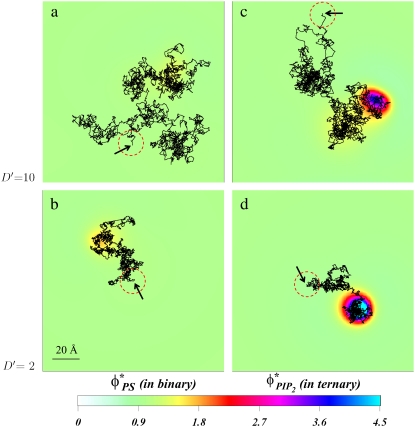
FIGURE 6.
Diffusion of charged spherical macroion on mixed membranes. The panels show the local surface charge densities after 0.6 μs of simulations (color scale) and the entire macroion trajectories in that time (connected black lines) for binary (PC/PS) mixture, D′ = 10 (a); for binary (PC/PS) mixture, D′ = 2 (b); for ternary (PC/PS/PIP2) mixture, D′ = 10 (c); and for ternary (PC/PS/PIP2) mixture, D′ = 2 (d). The red-dashed circles on each panel represent the projected size of the macroion with black arrows indicating the starting position of macroion center of mass. For clarity, the figures zoom in on the relevant membrane surface region explored by the macroion.

