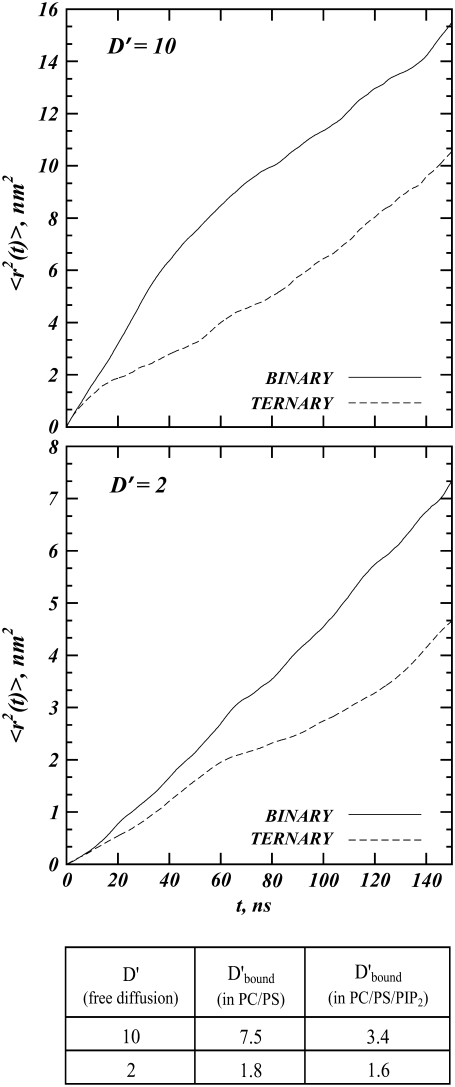
FIGURE 7.
Mean-square-displacement (MSD) as a function of time for D′ = 10 (upper panel) and D′ = 2 (lower panel). The table inset shows the apparent macroion and lipid diffusion coefficient ratios for free and for membrane-bound macroion, the latter calculated from linear regression analysis of the MSD plots.

