FIGURE 11.
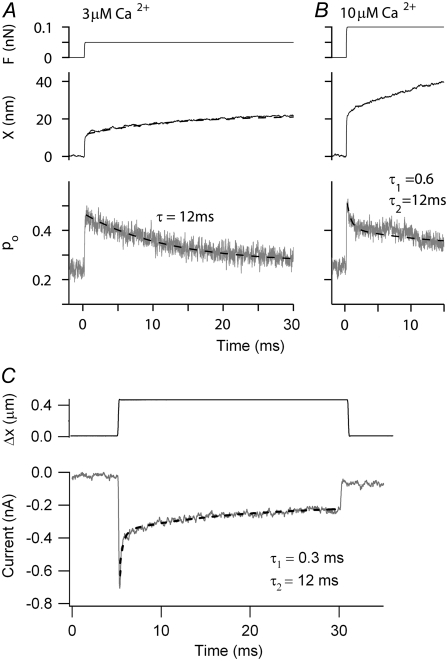
Kinetic contribution of myosin to MT channel responses (A) Simulated probability of MT channel opening, pO (lower) and hair-bundle displacements, X (middle), for a force step (upper) for CFA = 3 μM calcium shown on a longer time scale. The size of the force step was chosen to evoke pO ≈ 0.5. Note the slow changes in pO and X that are fit with a time constant of 12 ms. No fast component attributable to channel adaptation was visible. (B) Simulated probability of MT channel opening, pO (lower) and hair-bundle displacements, X (middle), for a force step (upper) at CFA = 10 μM. In addition to the slow component of adaptation, the change in pO now had a fast component of time constant 0.6 ms due to the effects of calcium on the MT channel. In these simulations, the rate constant for myosin-driven adaptation, kA, was 0.05 nm·ms−1·pN−1. (C) Experimental response of an OHC to an extended displacement step. The adaptation was fitted with two components with time constants of 0.3 ms and 12 ms. P8 rat, 1.5 mM external calcium.

