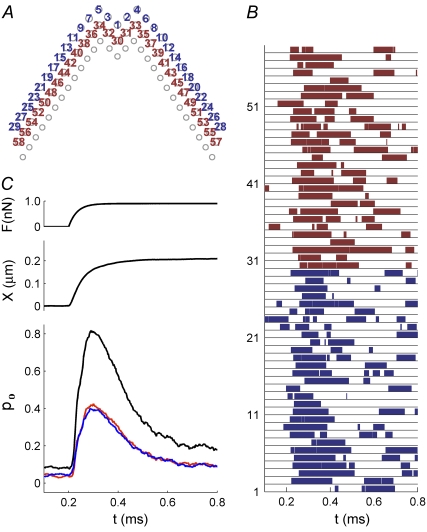
FIGURE 7.
Simulated responses of an OHC. (A) Top view of stereocilia showing numbering of MT channels in the first row (blue, 1–29) and second row (red, 30–58). MT channels are located solely at the top of each tip link, so the third row of stereocilia has no channels. (B) The channel numbers correspond to the numbers on the ordinate in the plot, showing the activity of each individual channel during a single force step of 0.9 nN, which was applied at t = 0.2 ms. The force was distributed equally to the tips of the tallest stereocilia. (C) Time course of the force step, F (upper curve), displacement, X (middle curve), and average probability of opening, pO (lower), computed from the individual responses in B. The average (pO) is identical for the first row (blue) and second row (red), the sum of the two responses shown in black.

