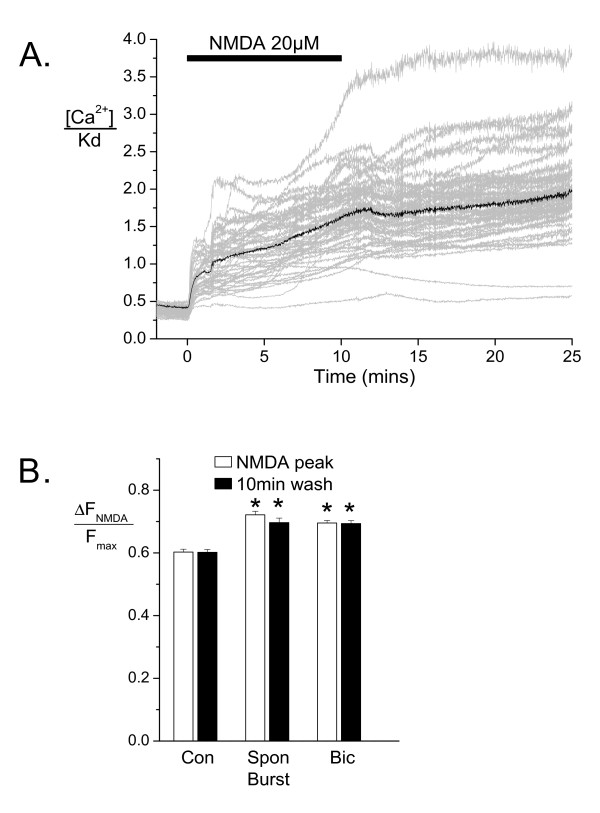
Figure 4.
Imaging of Ca2+ responses to excitotoxic NMDA receptor activation. (A) Shown are representative Ca2+ responses to 20 μM NMDA at 37°C from a representative overnight vehicle treated culture. Grey traces show the results recorded simultaneously from the soma (including nucleus) of multiple cells in the same field of view and black traces show the average of these cells. (B) Cumulative data measured at the peak of the response during NMDA application and at a point 10 min after washout of NMDA are shown from vehicle treated (Con, n = 250 cells on 5 coverslips) spontaneously bursting (Spon Burst, n = 128 cells on 2 coverslips) and bicuculline-treated coverslips (Bic, n = 316 cells on 6 coverslips). Peak NMDA responses and Ca2+ levels 10 min after NMDA washout in the bicuculline and spontaneously bursting groups were larger than those of the control groups (p < 0.01, ANOVA, Tukey's posthoc tests).

