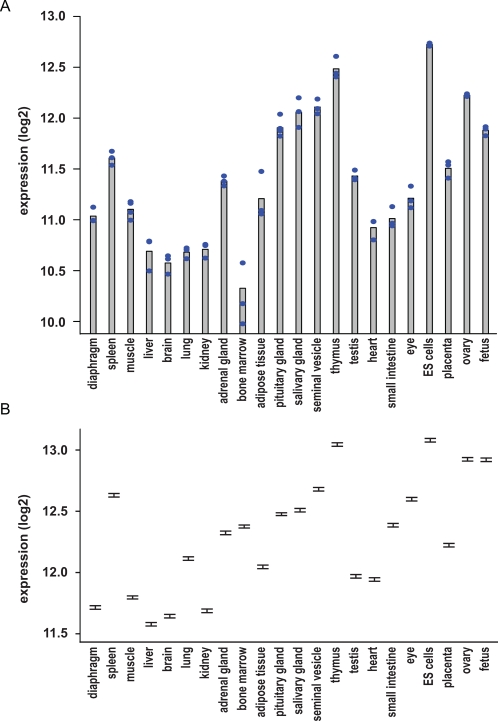
Figure 2. Tissue-specific co-expression of ribosomal protein genes.
(A) Expression of Rps13 in 22 different tissues. Individual measurements are displayed as blue dots and average corresponds to the top of the grey bars. Expression values are displayed in log2 scale. (B) Marginal means (estimated under the two-way ANOVA) of all ribosomal protein genes in each of the tissues, together with the 95 percent confidence interval.

