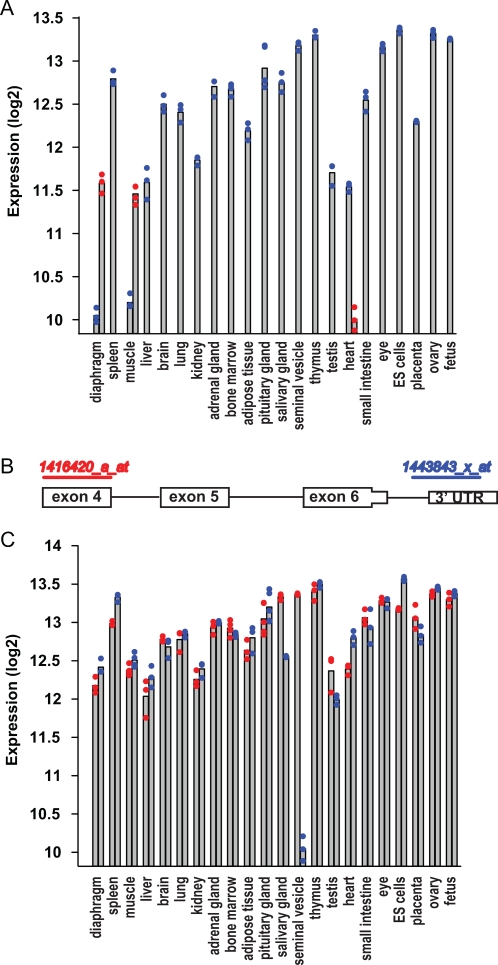
Figure 4. Two biological mechanisms underlying more pronounced variation in gene expression.
(A) Expression of Rpl3 (blue) and Rpl3l (red) in 22 different tissues. Note that tissues where Rpl3l was expressed (heart, diaphragm and muscle) had the lowest expression of Rpl3. (B) Schematic of Affymetrix probeset binding sites on the Rpl9 transcript. Probeset 1443843_x_at (blue) binds most 3′ and probeset 1416420_a_at (red) binds more upstream. (C) Expression levels of Rpl9 as detected by each of the probesets shown above. Both probesets yield similar signals, except in one tissue: seminal vesicles. This indicates that in seminal vesicles, an Rpl9 transcript variant exists.

