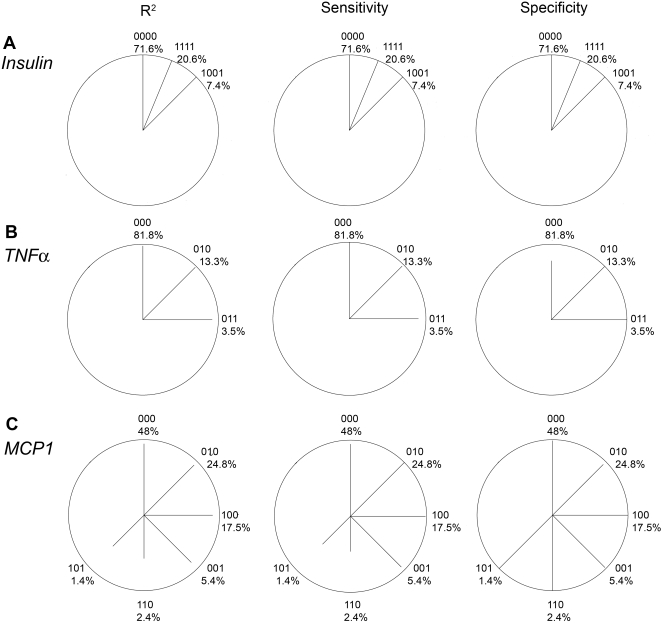
Figure 4. Haplotype-specific error measures:
Star plots for various genes displaying R2, sensitivity and specificity (analytically derived) as the length of the line for each common haplotype (frequency 3 1%). A line reaching the circle indicates a value of 100% (no error). Haplotypes are labelled using 0/1 coding for major/minor allele and stating the haplotype frequency. Lines are sorted clockwise by haplotype frequency beginning at the top with the most frequent haplotype. The angle between lines is given by the number of possible haplotypes, i.e. 360°/2L, where L is the number of loci. The proportion without lines thus indicates the proportion of rare or non-existing haplotypes (<1% frequency).

