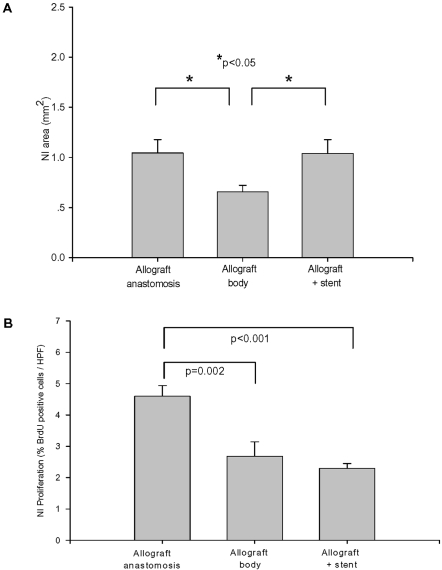
Figure 3. Characterization of NI formation in stented allograft.
A: The NI area of the allograft at the site of stent implantation, anastomoses, and the adjacent non-stented allograft body segment, n = 12, *p<0.05). B: Low level of proliferation in the non-stented body of the allograft and stented allograft segments. Proliferation at the anastomoses was higher at the non-stented body of the allograft (n = 12, p = 0.002) or stented allograft (n = 12, p<0.001).

