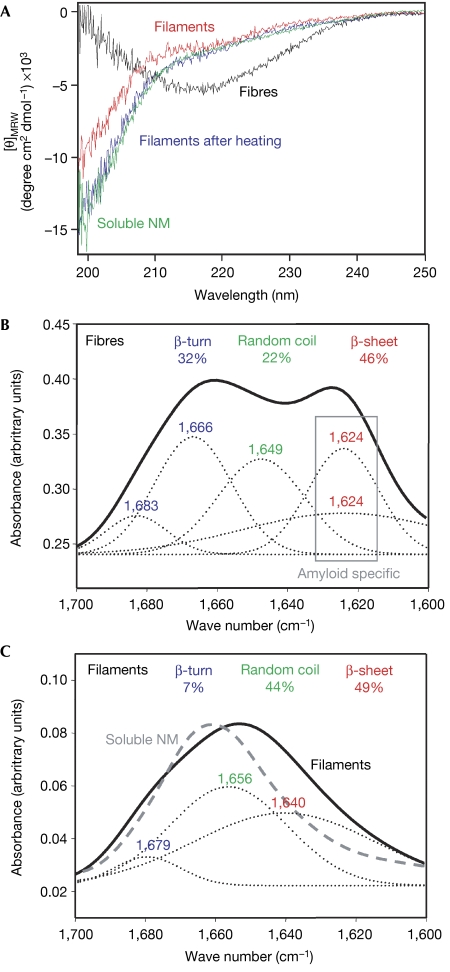
Figure 3.
Structural characterization of filaments. (A) Comparison of soluble (green), filamentous (red), fibrous NM (black) and filaments after heat treatment at 98°C (blue) by CD spectroscopy. (B, C) Comparison of (B) fibres and (C) filaments by FTIR spectroscopy using the amid I band (solid lines) between 1,600 and 1,700 cm−1. The secondary structure content was determined by deconvoluting the spectra using gaussian fits (dotted lines). Structure-content and -corresponding peaks are marked in identical colours: β-turn in blue, random coil in green and β-sheet in red. The FTIR spectrum of soluble NM is shown as a dashed grey line (C). CD, circular dichroism; FTIR, Fourier transformed infrared; [θ]MRW, mean residue weight ellipticities; M, highly charged middle region; N, asparagine- and glutamine-rich region.

