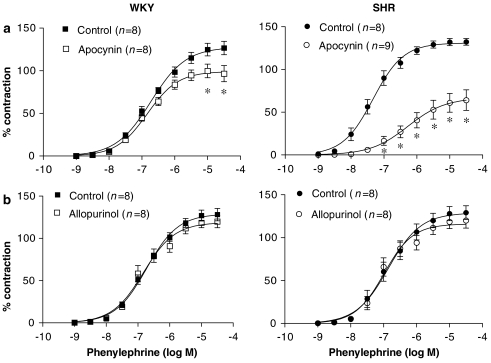
Figure 6.
Effect of (a) apocynin (0.3 mM) and (b) allopurinol (0.3 mM) on the concentration–response curve to phenylephrine in aortic segments from WKY and SHR. Results are expressed as a percentage of the response to 75 mM KCl for the number of animals indicated in parentheses. ANOVA (two-way): *P<0.05 vs control. WKY, Wistar Kyoto rat; SHR, spontaneously hypertensive rat.

