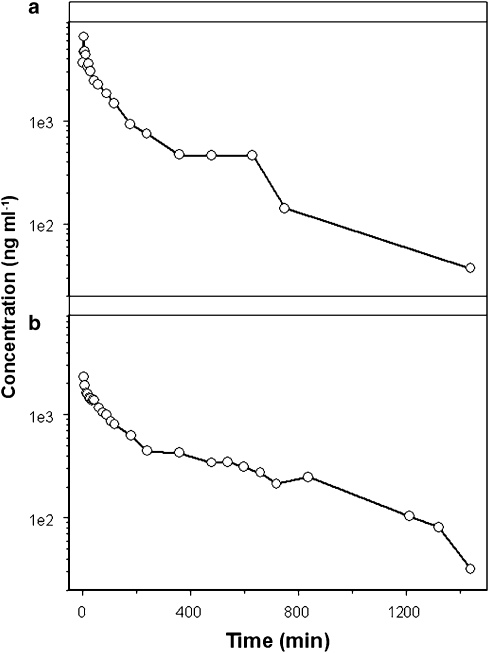
Figure 2.
A mixture model approach, which assumes the existence of sub-populations, was used to account for distinct patterns in the kinetic disposition of rofecoxib (10 mg kg−1). The upper panel (a) shows secondary peaks in the concentration vs time profile after i.v. administration, whereas the lower panel (b) illustrates the plateau phase in the concentration vs time profile observed after i.p. administration.

