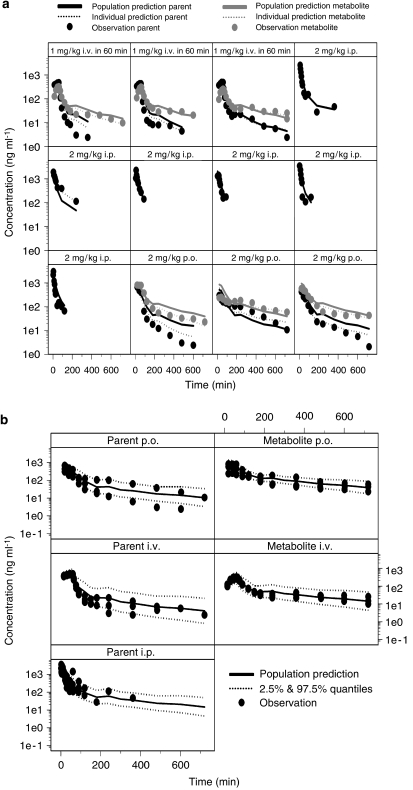
Figure 3.
(a) Concentration vs time profile of diclofenac and its metabolite 4-hydroxy diclofenac after a 60-min i.v. infusion of 1 and 2 mg kg−1 dose of diclofenac administered either orally or intraperitoneally. Dose was administered at time zero. The lines represent the population and individual predictions of parent and metabolite according to the oscillatory model described in Figure 1a. (b) Visual predictive check of the model for diclofenac (parent) and its metabolite. The measured plasma concentrations are shown along with lines representing the median population predictions and 2.5 and 97.5% quantiles according to the oscillatory model described in Figure 1a.

