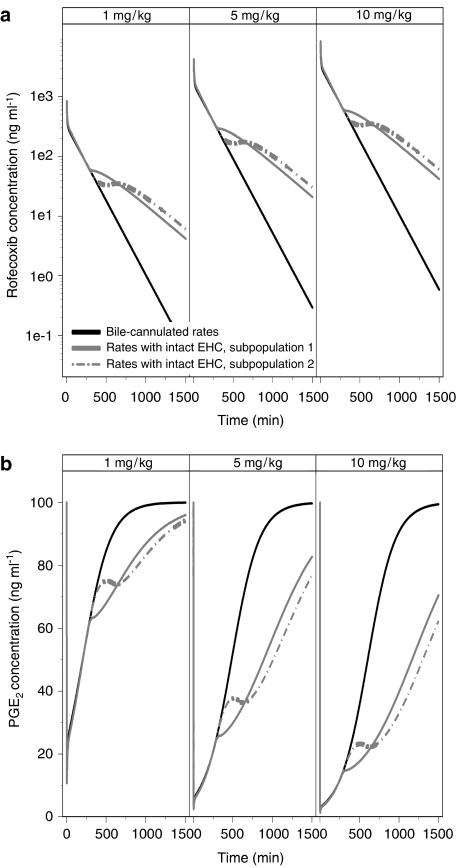
Figure 6.
(a) Simulated concentration vs time profile of rofecoxib after i.v. administration. (b) Simulated PGE2 inhibition vs time profile based on the inhibitory Imax model (Equation (5), see text for details). The lines represent rats with cannulated bile duct and the sub-populations 1 and 2 of rats with intact EHC.

