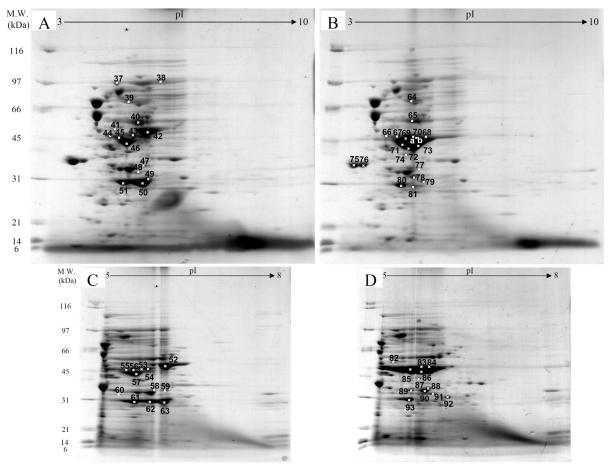
Fig 4.
Protein expression profiles of E. coli expressing native GFPuv (A, C) and chimeric VHbGFP (B, D) separated under pH ranges of 3-10 and 5-8, respectively and stained with colloidal Coomassie blue. (Numbers of protein spot denoted as identified protein represented in Table 1)

