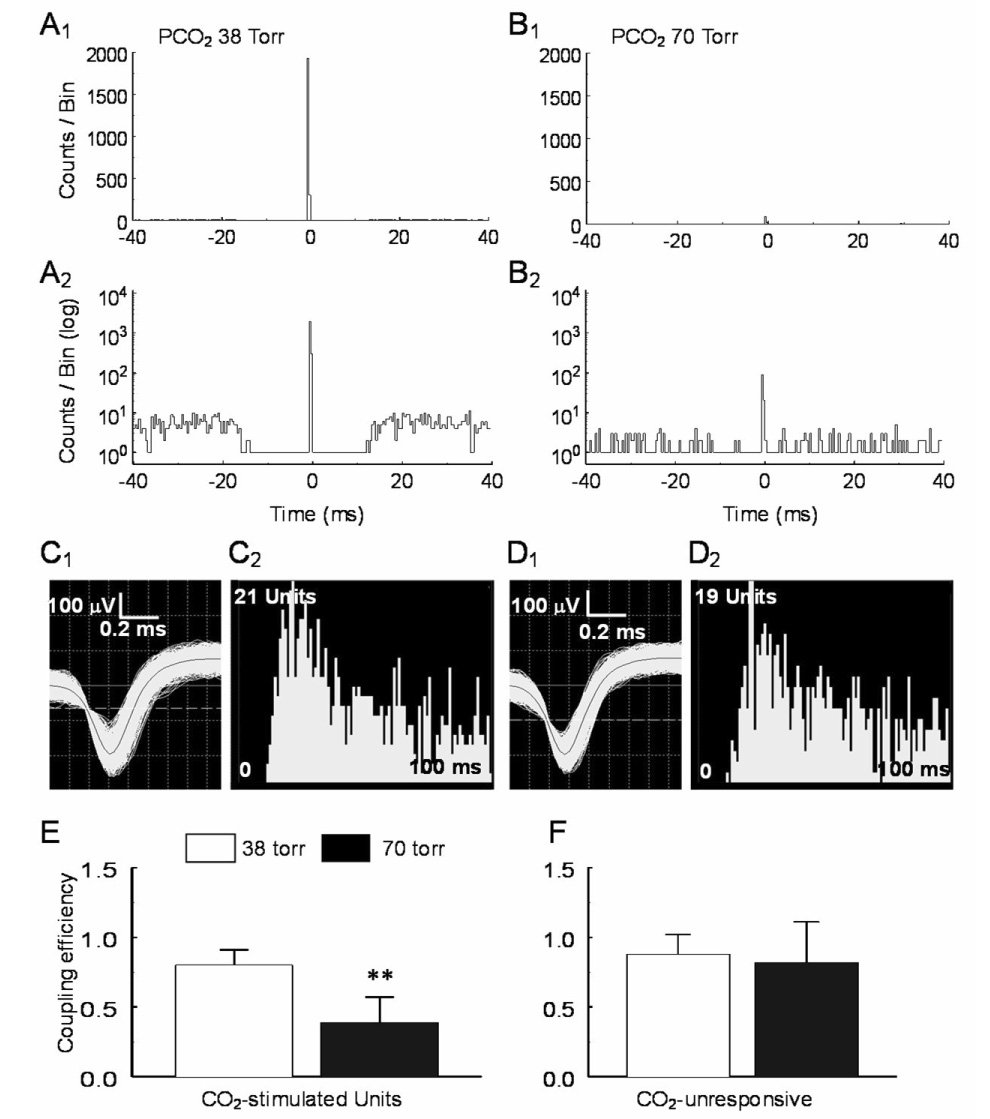
Fig. 4.

Suppression of electrical coupling during hypercapnia. A. A sharp central peak was seen in a pair of CO2-stimulated units. The spike trains of these units occurred almost always simultaneously with the background counts barely seen in regular scale (A1). Seen in log scale (A2), the background counts were not symmetric (coupling efficiency = 0.99). B1, B2. The coupling between these units was greatly diminished during high CO2 exposure (coupling efficiency = 0.10). C, D. The spike morphology and interspike histograms show single unit recordings with action potential duration > 1ms (C1, D1) for both units. E, F. Statistical analysis show that the electrical coupling is suppressed in CO2-stimulated units (P=0.006, n=4) but not in CO2-unresponsive units (P=0.21, n=12). Data are represented as mean ± S.D.
