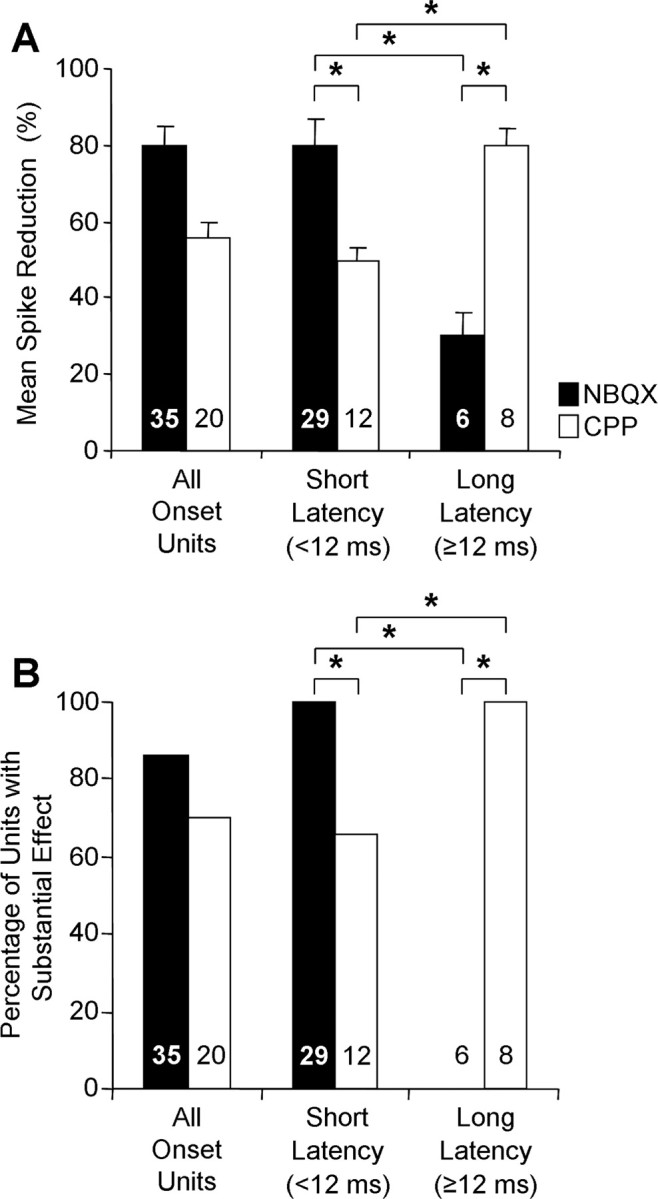
Figure 5.

Contributions of AMPARs and NMDARs to onset temporal patterns depend on first-spike latency. A, B, The effects of drug application across the sample of onset units are plotted as a mean reduction in the number of spikes (A) and the percentage of units showing a substantial (>50%) reduction in spikes (B). Both NBQX and CPP had major effects across the sample of onset units (All Onset Units), but this was composed of distinct subgroups based on first-spike latency. Error bars in A indicate SEM. Statistical comparisons for different drugs within a latency group and for each drug across latency groups were performed using two-sample t tests assuming unequal variances (A) and 2 × 2 χ2 tests (df = 1) (B). *p < 0.01. Numbers within histogram bars indicate sample size. No tests were performed on the group All Onset Units because it was composed of unequal numbers of short- and long-latency units.
