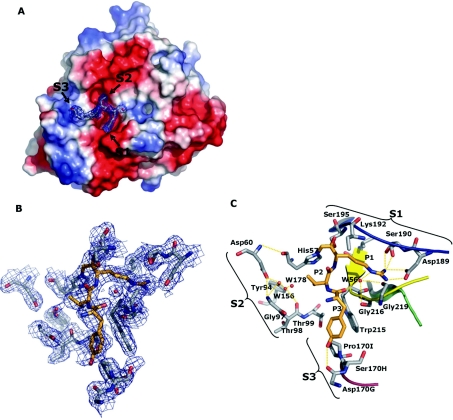
Figure 3. Crystal structure of Trp-Tyr-Thr-Arg-cmk–FVIIa–sTF1-209 obtained at a 2.05 Å resolution.
(A) The structure is shown in the standard orientation. The orientation of (B) and (C) is changed slightly to give an optimal view. (A) View of the protease domain in an electro-potential surface plot with the inhibitor shown with a 2Fo-Fc electron-density map with 2σ cut-off. Colour-coding: negative charges are in red, positive charges of in blue, carbon is in grey, oxygen is in red and nitrogen is in blue. The S1, S2 and S3 pockets are indicated with arrows. Note the striking difference between S1 and S2 compared with S3 in which the former are distinct cavities with defined boundaries and high degree of electro-negativity, whereas the S3 pocket is flat with an almost neutral electro-potential surface. No obvious S4 pocket was identified surrounding the active site in accordance with the lack of electron density for the P4 residue. (B) Close-up of selected residues within a 5 Å sphere of the covalently bound inhibitor shown with a 2Fo-Fc electron-density map with 2σ cut-off. As indicated, the electron density traced the active-site residues well. Carbons of the inhibitor are coloured orange to distinguish them from protein carbons. (C) Specific interactions between the selected active-site residues and covalently bound inhibitor are highlighted [the view is slightly tilted compared with (B)]. The S1, S2 and S3 composition is shown with brackets, and residue identifications are with chymotrypsin numbering. Hydrogen-bonding networks are shown in orange dotted lines. The following secondary elements are coloured accordingly: Lys336–Gly346 is in blue, His373–Tyr377 is in green, Val362–Ala369 is in yellow and Gln313–Asn322 is in red.

