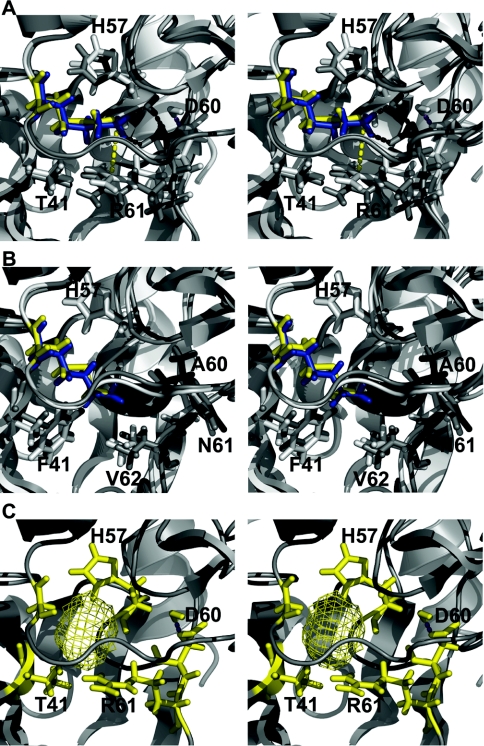
Figure 5. Stereo views of structural models for WT and elafin mutants complexed to HNE and PPE.
(A) and (B) Molecular representations of WT elafin–enzyme complex (white) superimposed on to an elafinM25K–enzyme complex (grey). The WT Met25 residue is yellow and Lys25 blue. Residues making direct contact with residue 25 from the inhibitor are in stick representation. Protein backbones are in ribbon representation. Magenta and black dashed lines represent hydrogen bonds for the complex containing pre-elafin and pre-elafinM25K respectively. (A) Inhibitors complexed to PPE. The yellow dashed line represents the distance between Lys25i side chain nitrogen atom and Arg61e ζ carbon. (B) Inhibitors complexed to HNE. (C) ElafinM25G complexed to PPE. The yellow mesh represents the cavity left by the replacement of Met25 by Gly25.

