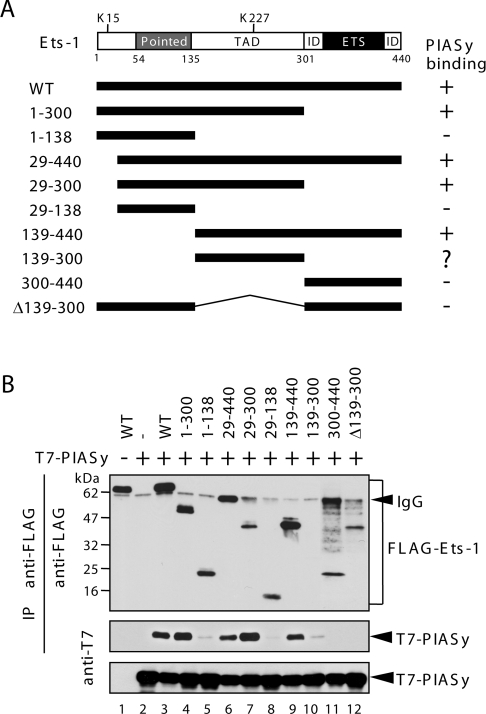
Figure 4. Mapping of Ets-1 for the PIASy interaction domain.
(A) Schematic diagrams of the Ets-1 constructs used. The two SUMOylation sites (Lys15 and Lys227) are indicated. Pointed, Pointed domain; ID, inhibitory domain; ETS, ETS domain. Numbers refer to amino acid residues. The interaction of Ets-1 mutants with PIASy following immunoprecipitation (IP) is summarized. (B) Lysates from COS-7 cells were co-transfected with FLAG–Ets-1 mutants and T7–PIASy were immunoprecipitated with an anti-FLAG antibody. The immunoprecipitates were then analysed by immunoblotting with an anti-FLAG antibody (top panel) or an anti-T7 antibody (middle panel). The middle panel shows the Ets-1-bound PIASy. The levels of transfected T7–PIASy protein in the total cell lysates are shown in the bottom panel.

