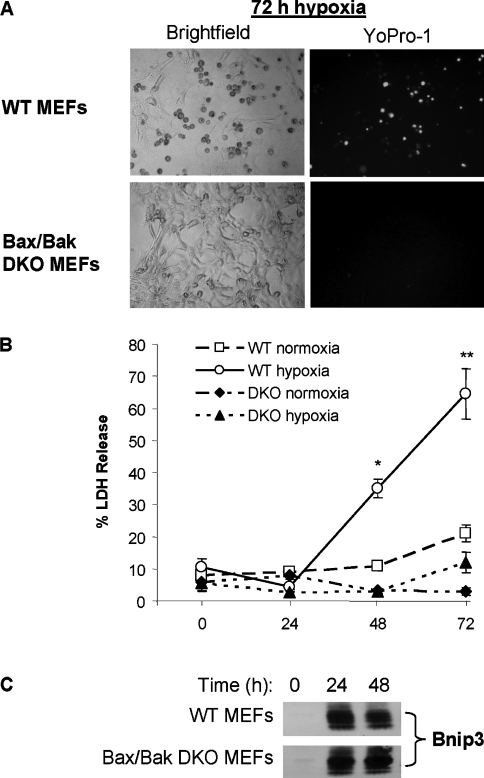
Figure 1. Cells lacking Bax and Bak are resistant to hypoxia.
(A) Bright-field and YoPro-1 fluorescence microscopy of WT and Bax/Bak DKO MEFs after 72 h of hypoxia. (B) WT and Bax/Bak DKO MEFs were subjected to hypoxia and cell death was assessed by measuring LDH release as described in the Materials and methods section. (C) Bnip3 protein levels were determined by Western blot analysis. Results are means±S.E.M., n=4 (*,**P<0.05 compared with normoxia).

