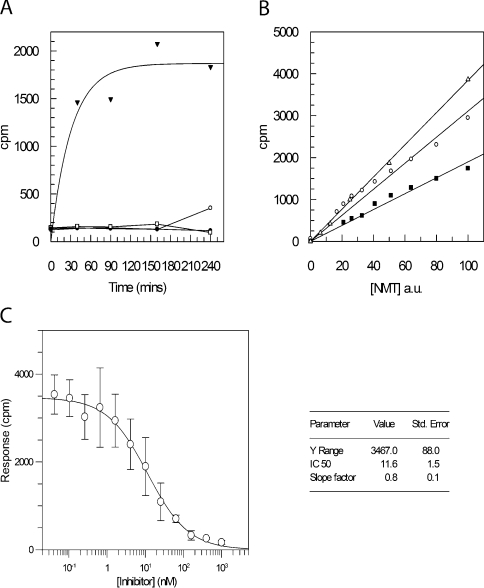
Figure 2. Development of SPA for NMT activity.
(A) The SPA was conducted with 500 nM PfARFlong substrate, 500 nM myristoyl CoA and 100 ng of PfNMT at 37 °C. Sampling was conducted at five different time points (0, 40, 90, 150 and 240 min) to monitor reaction progression. Four different samples were used in a typical reaction timecourse (▼), a reaction with no peptide (○), no NMT (●) and AlaARF peptide replacing the peptide substrate (□). (B) The concentration of NMT was titrated by serial dilution in otherwise identical reactions incubated for 30 min using 125 nM ARFlong peptide and 125 nM myristoyl-CoA, in a final volume of 100 μl. Enzyme concentration, as a percentage of the highest concentration used, is plotted against c.p.m. for reactions using CaNMT (△), PfNMT (■) and HsNMT1 (○). A close approximation to a linear fit demonstrates that enzyme concentrations can be selected so that the amount of enzyme is rate-limiting under the experimental conditions selected. a.u., arbitrary units. (C) An IC50 value for inhibitor UK-362091 with CaNMT was determined using the SPA. Inhibitor concentrations were varied from 1 μM to 42 pM in otherwise identical reactions (125 nM PfARFlong peptide, 125 nM myristoyl-CoA and 3 ng CaNMT). A plot of c.p.m., after 30 min incubation at 37 °C, against inhibitor concentration allows a four-parameter fit to derive the point at which the signal is half maximal, the IC50. Values are means±S.D. for three experiments. The IC50 value obtained is 11.6 nM (see inset), consistent with a previous evaluation of 19 nM (Pfizer, personal communication).

