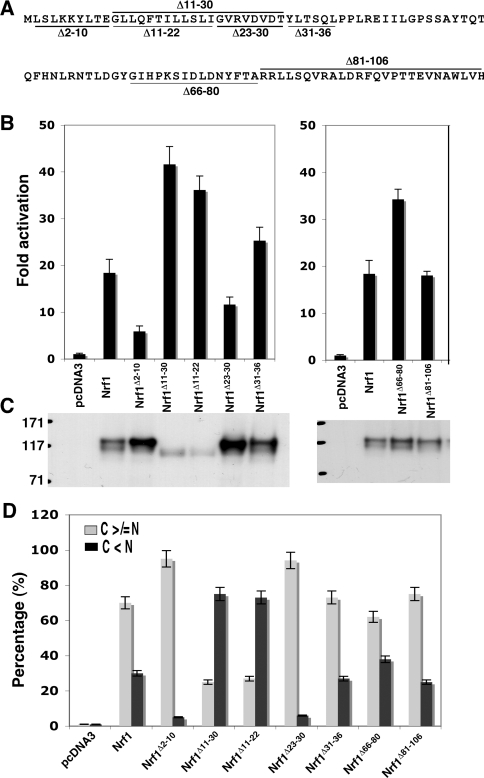
Figure 3. NHB1, but not NHB2, regulates Nrf1 by controlling its subcellular distribution.
(A) Diagrammatic representation of sequences deleted from within the NTD of Nrf1. (B) The expression constructs for wild-type Nrf1 or those lacking the sequences shown in (A) (1.2 μg DNA of each) were transfected into COS-1 cells together with 0.6 μg of PTKnqo1-ARE-Luc and 0.2 μg of the pRL-TK and β-gal reporter plasmids. Approx. 36 h after transfection, the cells were harvested and luciferase reporter activity was measured. The transactivation activity was calculated and is presented as a fold change (mean±S.D.) from three independent experiments, each performed in triplicate. (C) Ectopic V5-tagged Nrf1 proteins in the COS-1 cells were resolved by 7% NuPAGE and examined by immunoblotting; samples loaded in each well contained equal amounts of β-gal activity. (D) The Nrf1 expression constructs (1.3 μg DNA of each), together with an ER/DsRed construct, were cotransfected into COS-1 cells. Subsequently, the Nrf1 proteins were analysed using immunocytochemistry with a FITC-coated secondary antibody, followed by confocal microscopy, as described in the legend for Figure 2. The quantitative data shown here were calculated by determining the percentage of cells showing predominantly an extra-nuclear stain (i.e. cytoplasmic plus ER, called simply C) was greater than or equal to the nuclear stain (called N), as opposed to the percentage of cells in which the extranuclear stain was less than the nuclear stain (100 cells were counted); some of the images from which these data were obtained are shown in Supplementary Figure S2 at http://www.BiochemJ.org/bj/408/bj4080161add.htm.

