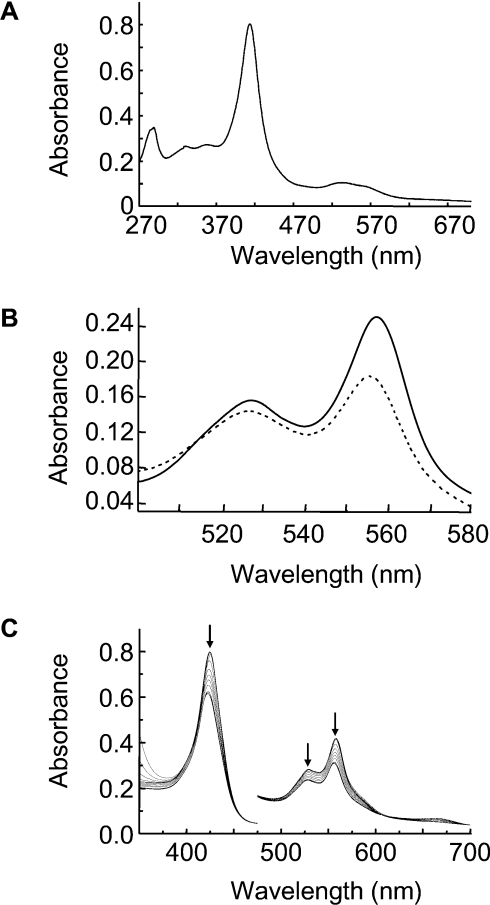
Figure 2. UV–visible absorption spectra.
(A) UV–visible spectrum of ferric S160C (conditions=0.1 M potassium phosphate, pH 7.0). (B) Reduced pyridine haemochromagen spectrum of ferrous S160C immediately after (solid line) and 14 h after (broken line) reduction. The reduced haemochromagen spectrum shown in the solid line is identical with that obtained for haem extracted from ferric S160C (see the Results section). (C) UV–visible spectrum of ferrous S160C monitored every 1 h for 14 h (conditions=0.1 M potassium phosphate, pH 7.0).

