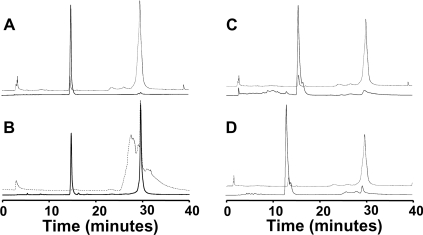
Figure 3. HPLC analyses.
HPLC chromatogram of S160C before (A) and after (B) reduction measured at 398 nm (solid line) and 280 nm (broken line). (C) HPLC chromatogram of S160C after oxidation with H2O2, measured at 398 nm (solid line) and 280 nm (broken line). (D) HPLC chromatogram of S160C reconstituted with mesoporphyrin after reduction, measured at 398 nm (solid line) and 280 nm (broken line).

