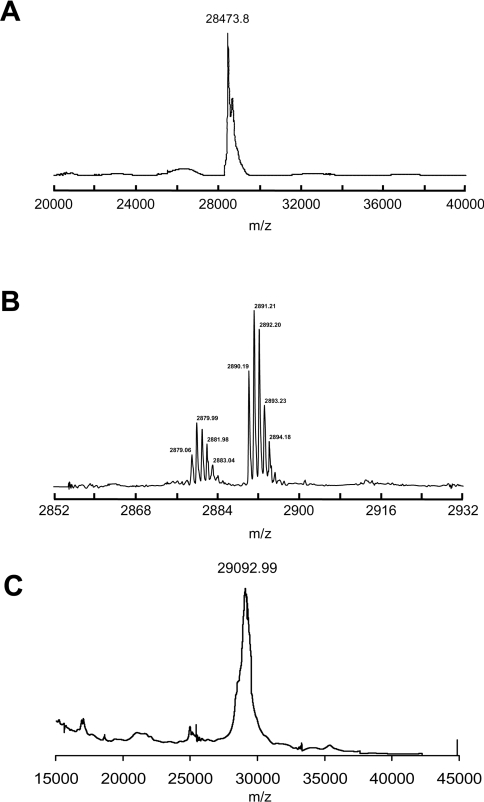
Figure 4. Mass spectrometric analyses.
(A) MALDI–TOF mass spectrum of ferric S160C. (B) Expanded view (m/z=2850–2930 region) of the MALDI–TOF mass spectrum of S160C after reduction, showing the haem–peptide fragment at m/z=2880. (C) MALDI–TOF mass spectrum of S160C after reduction. Each spectrum was collected ten times to obtain the average mass and S.D.

