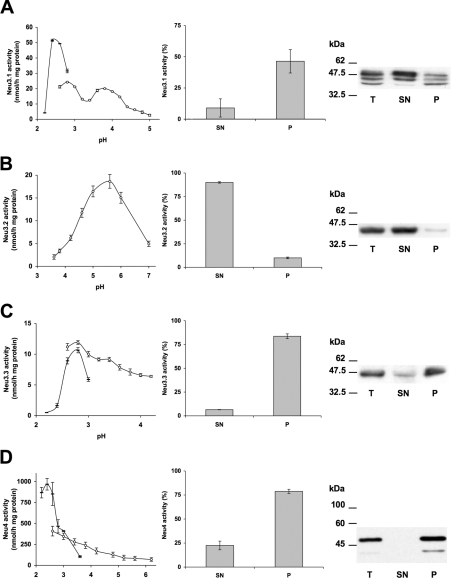
Figure 7. Biochemical characterization of zebrafish sialidases.
(A) Neu3.1-, (B) Neu3.2- and (C) Neu3.3- and (D) Neu4-Myc fusion proteins were expressed in COS7 cells. Left column: the specific activity of different zebrafish sialidases towards 4-MU-NeuAc over the pH range 2.2–7.0. The enzymatic assay was carried out using Tris/glycine buffer from pH 2.2 to 3.0 (black bar) and sodium citrate/phosphate buffer from pH 2.6 to 7 (white circle). Variations of the values are indicated by the error bars (n=4). Middle column: sialidase activity of the supernatant (SN) and pellet (P) obtained by ultracentrifugation of the total lysates at 100000 g. The rate of hydrolysis of 4-MU-NeuAc is expressed as a percentage of the value detectable in the total lysates. Variations of the values are indicated by the error bars (n=3). Right column: Western blot analysis of protein sample (20 μg) of total cell lysate (T) and supernatant (SN) and pellet (P) obtained by ultracentrifugation. Detection of the fusion proteins was performed using anti-Myc antibody and secondary horseradish-peroxidase-conjugated isotype-specific antibody, followed by chemiluminescence developing reagents. Sizes are given in kDa.

