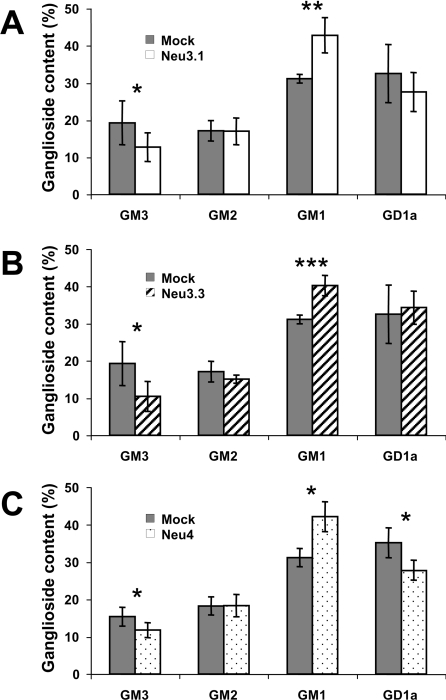
Figure 8. Ganglioside pattern of COS7 cells expressing zebrafish sialidases Neu3.1, Neu3.3 and Neu4.
Cells transfected with the different zebrafish sialidases were pulsed for 2 h with [1-3H]sphingosine, 30 nM final concentration. After 40 h (Neu3.1 and Neu3.3) and 20 h chase (Neu4), cells were harvested and treated for lipid analysis (see the Materials and methods section). The ganglioside relative contents are compared with the one observed in mock-transfected cells. Variations in the ganglioside relative contents are indicated by the error bars (n=6). Significance according to Student's t test: *, P<0.05; **, P<0.005; ***, P<0.0005.

