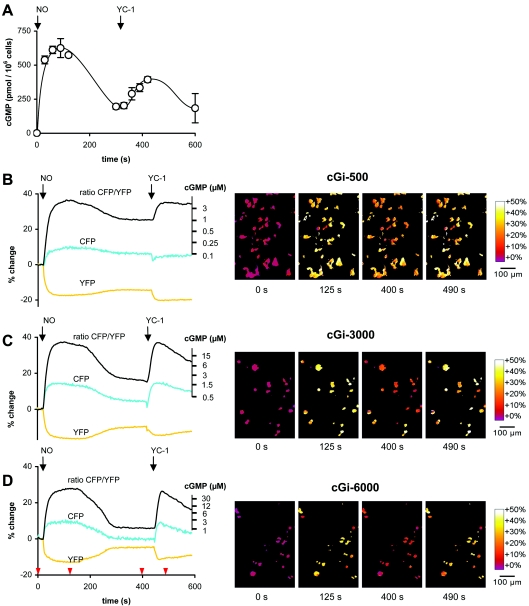
Figure 4. cGMP signals in living cells.
cGMP signals in HEK-293 cells stably expressing the NO receptor GC and PDE5 were elicited by NO and YC-1 stimulation (indicated by arrows) and recorded by (A) RIA and fluorescence microscopy using the cGMP indicators (B) cGi-500, (C) cGi-3000 and (D) cGi-6000. (B) and (D) show the simultaneously registered mean CFP and YFP emissions (cyan and yellow respectively) and the mean CFP/YFP emission ratio (black) of the viewing field depicted in the right panel, each normalized to the baseline emission before application of NO (see the Materials and methods section). The second ordinate details the intracellular cGMP concentrations, which were calibrated as described previously (see the Materials and methods section for further information). Representative ratiometric images underlying the black CFP/YFP emission ratio curves at the time points indicated by red arrowheads are shown on the right.

