
Fig 4.
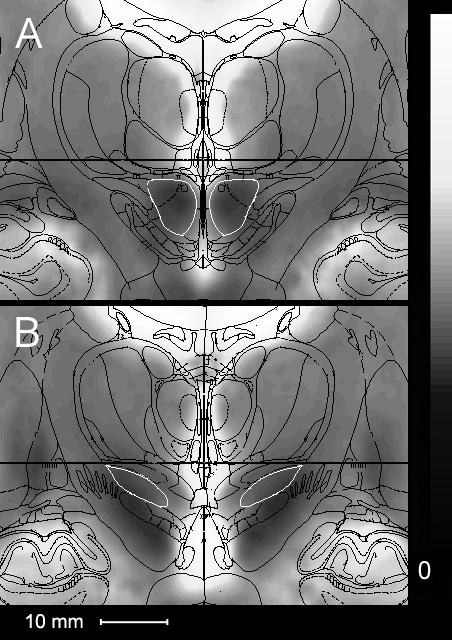
Composite mean MR images of 29 STN DBS patients. A corresponds to section 39 (22.6 mm posterior to AP) of Mai et al. (2004). B corresponds to section 34 (16.0 mm posterior to AP). Both sections show the structural boundaries of Mai overlaid with the RN outlined in white in A and the STN outlined in white in B.