
Figure 3. Low-affinity FLII81E - 1μ glutamate sensor imaging.
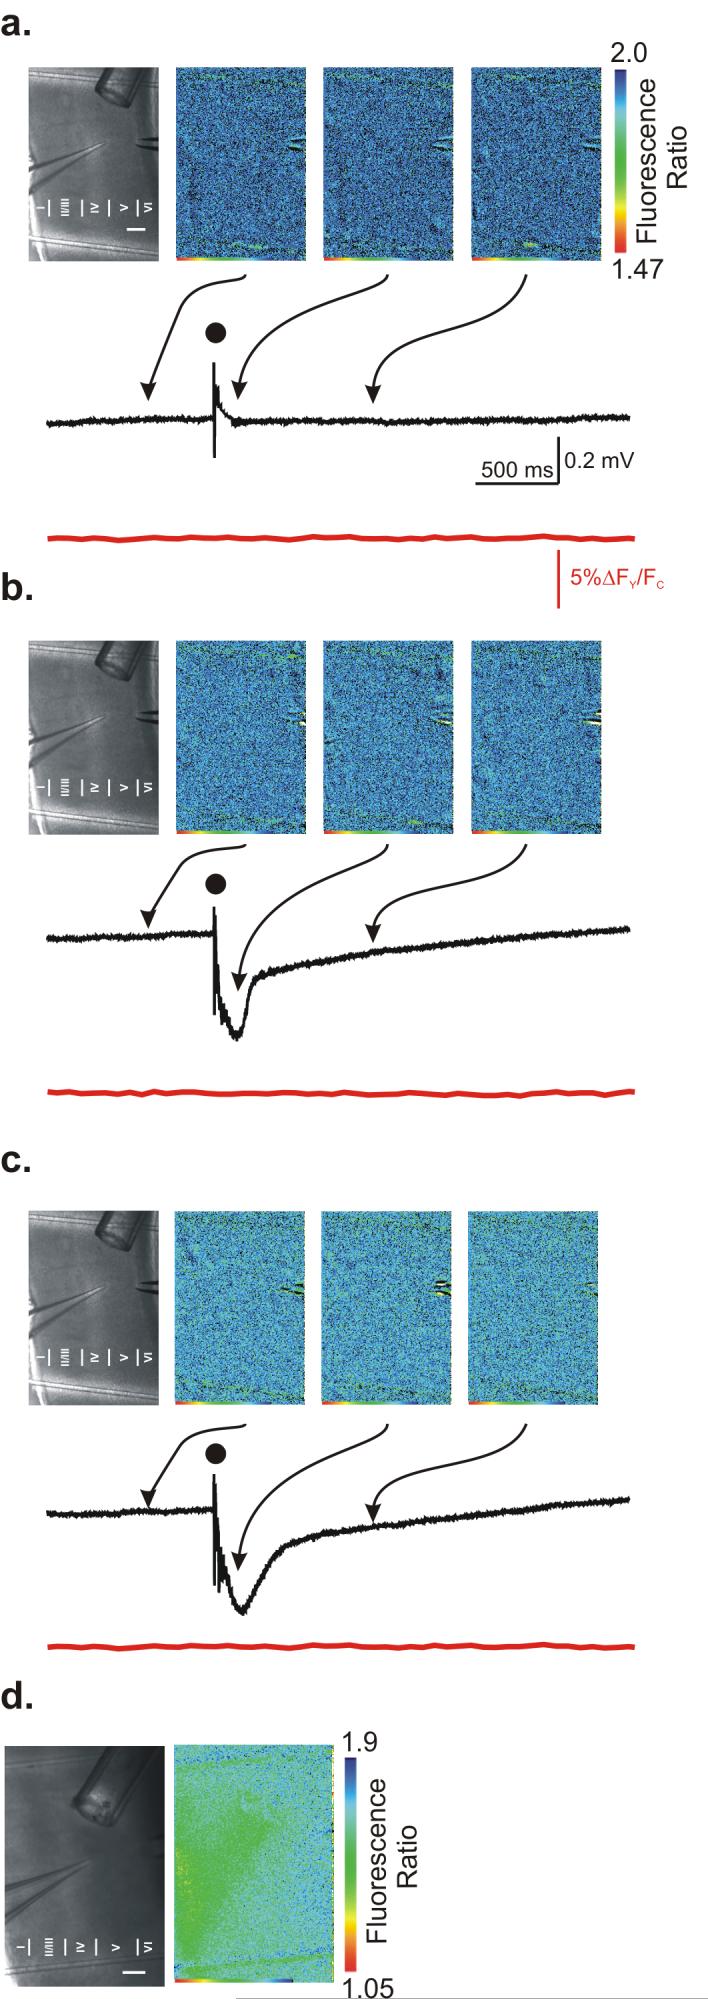
Glutamate imaging with simultaneous cortical field recording under (a) control conditions, (b) in the presence of 10 μM GABAzine, and (c) in the presence of 10 μM GABAzine + 25 μM TBOA. (a, b, & c) (top, left) Bright field image of the cortical slice. Experimental layout is the same as in Figure 2. (top, right) Three individual glutamate FRET sensor images from ≈200 ms before stimulation (left), ≈80 ms after stimulation (center), and ≈1 s after stimulation (right). (center) Evoked cortical field recordings performed simultaneously with glutamate images. Dot indicates time of stimulation. (bottom) Normalized ROI analysis of glutamate FRET sensor images. (d). Local application of 10 mM glutamate induces large fluorescence ratio response.