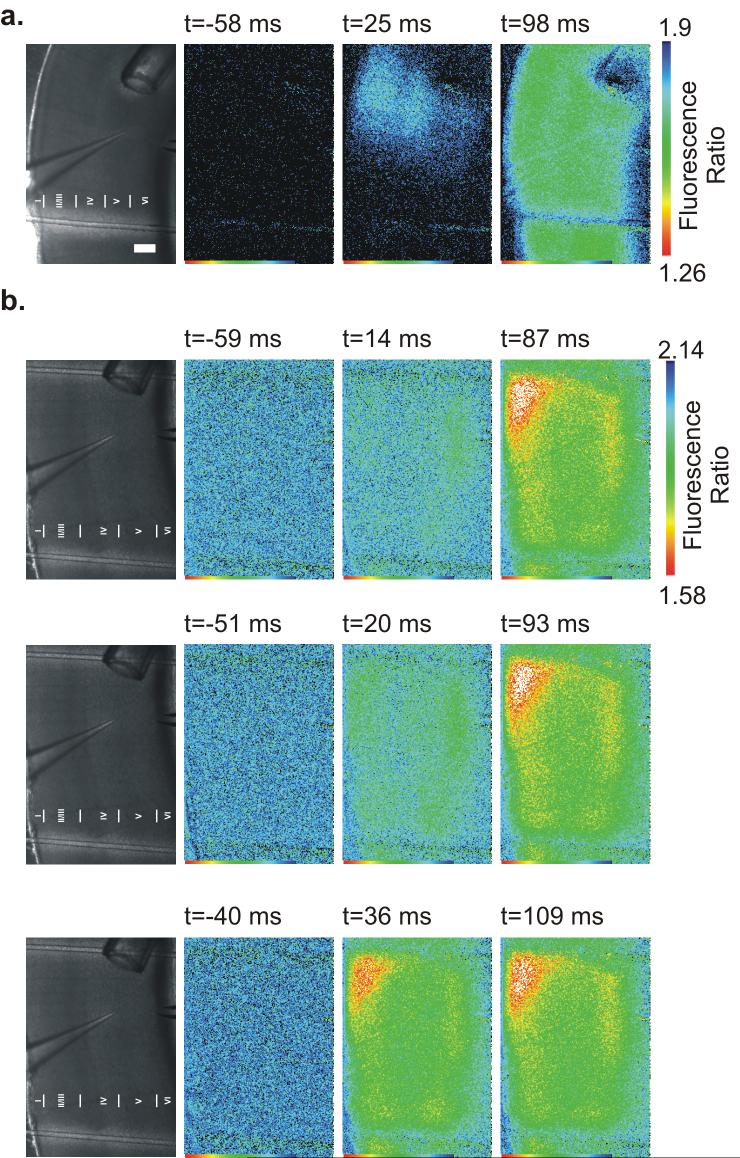
Figure 5. Spatioltemporal properties FLII81E - 1μ glutamate sensor during full field imaging.
(a, left) Bright field image of the cortical slice. Scale Bar = 250 μM for all images. (right) FLII81E - 1μ glutamate sensor images taken 58 ms before stimulation, 25 ms after stimulation, and 98 ms stimulation in the presence of 10 μM GABAzine. A single column of cortex is initially activated followed by recruitment of a larger network. (b, left) Bright field image of the cortical slice as in (a). (right) FLII81E - 1μ glutamate sensor images taken immediately before (left) and after (center and right) three successive electrical stimuli (10 μM GABAzine and 25 μM TBOA). Times of exact frame capture relative to electrical stimulation are noted above each image. Due to slight jitter in the image capture time, different time points during the onset of glutamate release can be seen.

