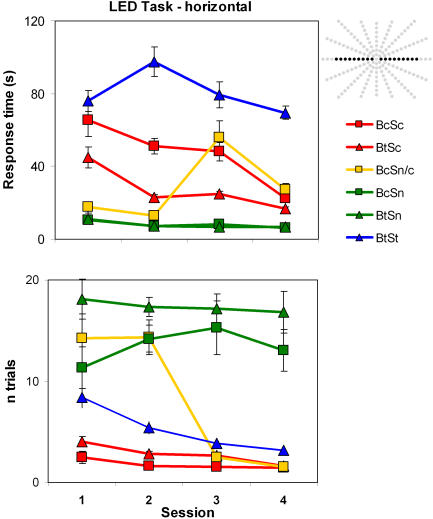
Figure 3. The horizontal LED task results from Experiment 1.
Top) Response times as a function of session. The inserted array shows the potential target LEDs (black) in the perimeter. The subjects knew that these were confined to the horizontal meridian. Bottom) Accuracy is plotted as a function of the number of LEDs pushed on a given trial until hitting the target (“1” is perfect performance). All error bars denote standard error of the means in this and all figures.

