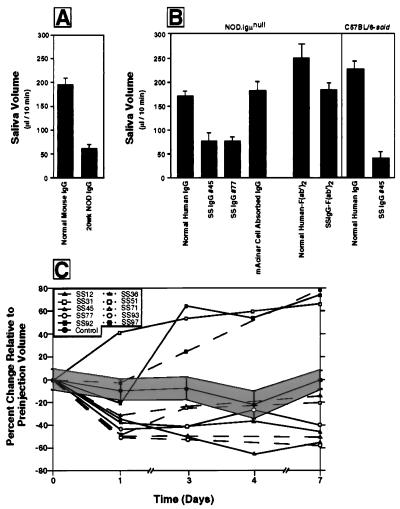
Figure 3.
Alteration in the levels of saliva volume generated in NOD.Igμnull mice after a single or repeated injection of normal serum IgG, parental NOD, or Sjögren’s syndrome serum IgG fractions. (A) Histogram of saliva volume collected 24 hr after injection of NOD.Igμnull mice with normal or NOD/Lt sera IgG fractions. (B) Histogram of saliva volume after injection with four normal human or four patient IgG fractions. Salivary flow was collected from the oral cavity beginning 1 min after stimulation (n = 4 mice/injection regimen). Mice were injected with 100 μg IgG or 10 μg F(ab′)2. All values are expressed as the mean saliva flow/10 min ± SE. (C) Individual mice injected for 1 week with normal human IgG (n = 5) or individual Sjögren’s syndrome patient (n = 10) IgG fractions.

