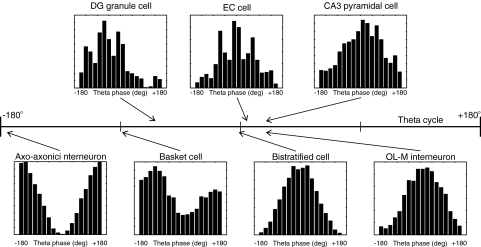
Fig. 2.
Theta phase of phenomenological afferent cell activity. Activities of representative model cells from each population group of afferent place cells and interneurons are summarized as theta phase firing histograms. Arrows indicated the theta phase (−180° to 180°) at which the corresponding population activity is maximal. For basket cell interneurons, maximal and minimal activity theta phase are −89° and 0°, respectively. For other cell populations, minimal activity is offset 180° from the maximal activity theta phase

