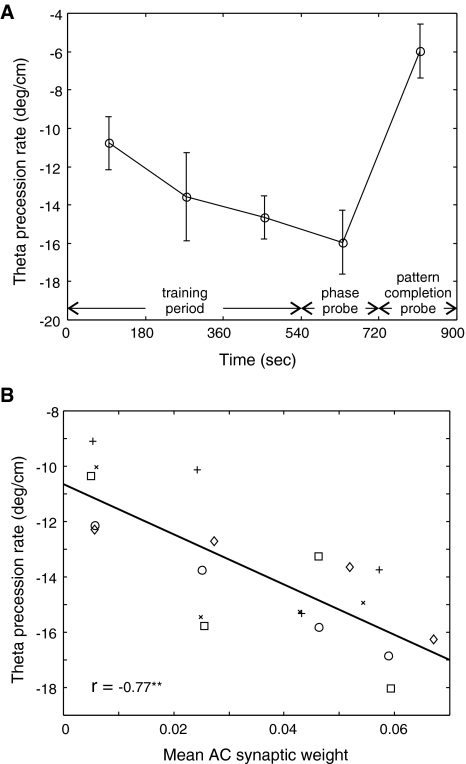
Fig. 5.
Evolution of theta phase precession over time. Afferent spike trains and neurotransmitter release are modeled using a random number generator that is seeded to produce repeatable results. Multiple simulations with different random number seed values were used to create additional results and the resulting theta phase precession rates, including those shown in Fig. 4, are summarized here. (A) Mean theta phase precession rates found are shown with standard error of measurement as indicated (N = 5). (B) Mean theta phase precession rate is fitted as a function of mean AC weight in the corresponding time period with individual data points shown in a scatter plot

