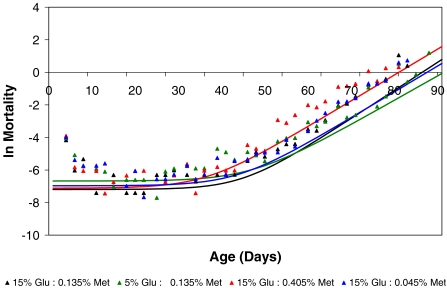
Figure 3.
Observed and projected mortality rates by diet. Scatter plot of observed mortality rates –lnμx (triangles) and projected mortality curves (lines) as a function of age. The projected mortality curves are fitted according to the parameters derived from the Gompertz-Makeham models given in Table 3

