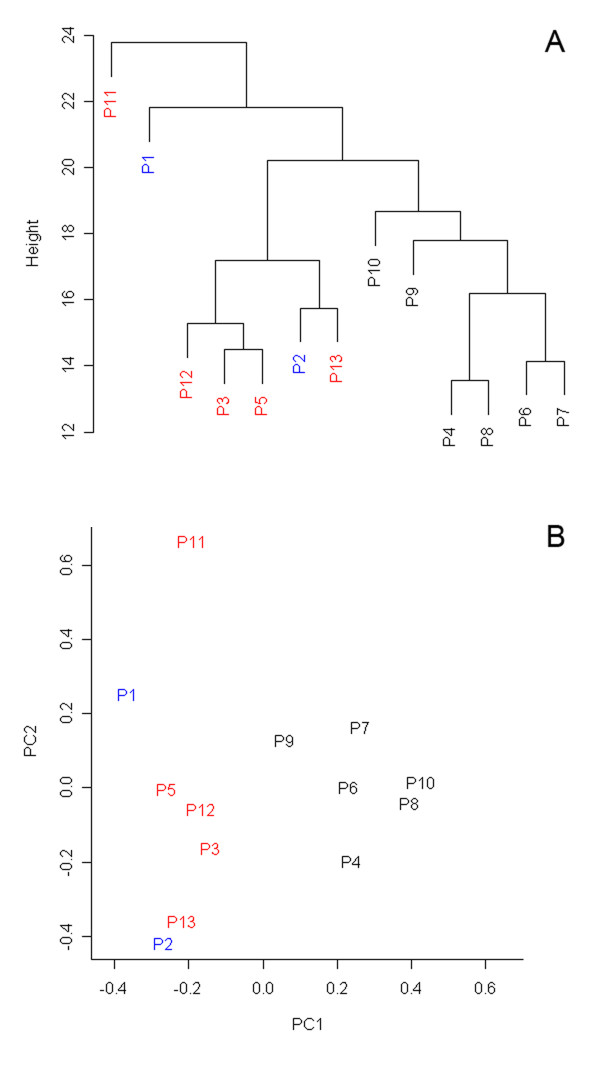
Figure 1.
Results of unsupervised clustering methods. A) Dendrogram resulting from two-dimensional hierarchical clustering of all genes across all patient samples performed using Euclidean distance metrics and average linkage clustering algorithm. B) Two-dimensional PCA plot of all expression data showing the separation of samples forming N1 group. Patients from M, N1 and N2 groups are shown in blue, black and red, respectively.

