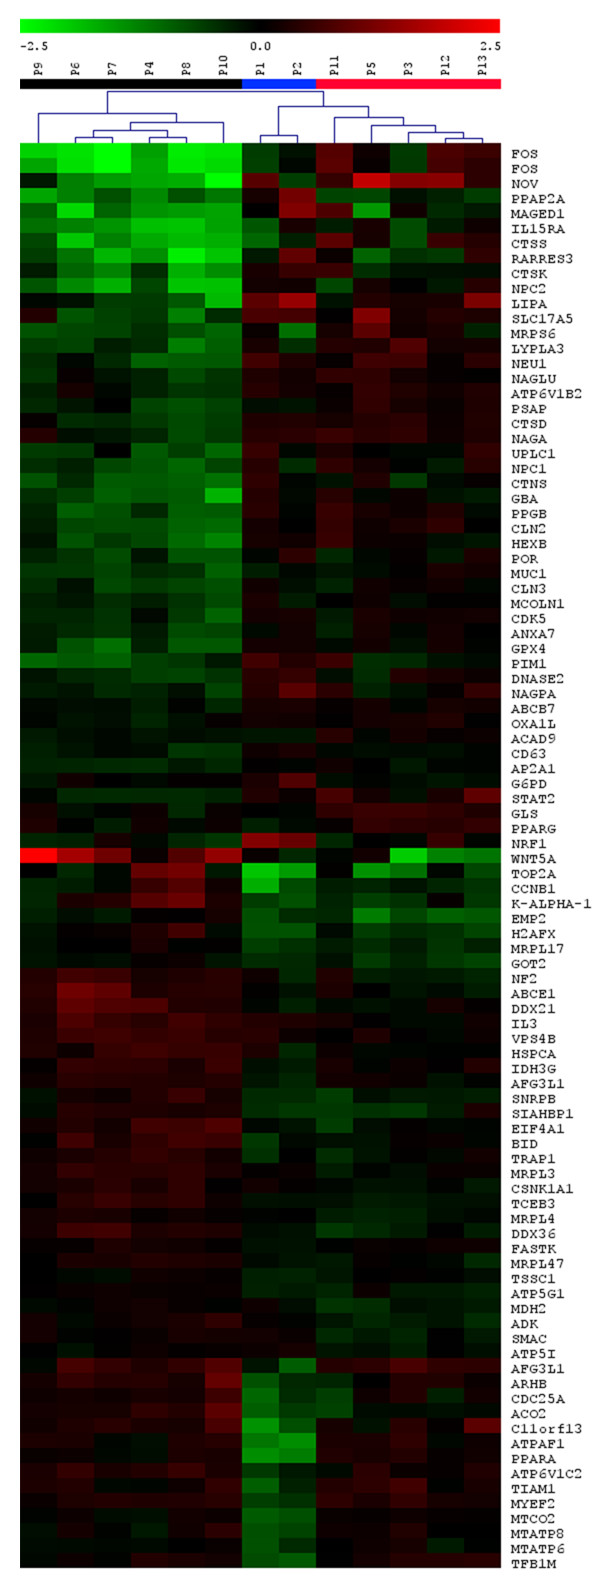
Figure 2.
Differentially expressed genes defined by ANOVA analysis. Heatmap of genes detected as differentially expressed between defined patient groups using ANOVA analysis and unadjusted P < 0.01 significance level. The results are shown as Log2 ratio of relative gene expression signal in each patient sample to average of this of control samples. Ratio values are represented as the pseudo-color whose scale is shown in corresponding lookup picture.

