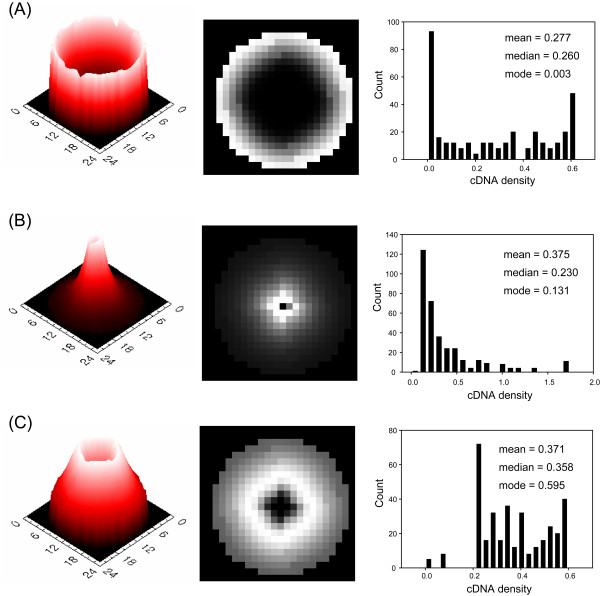
Figure 4.
Three types of morphology of simulated cDNA deposit. (A) The doughnut-shaped spot was generated with x0 = 1000, K = 0.002, a = 0.4, and KV = 2.0. (B) The peak-shaped spot was generated with x0 = 300, K = 0.001, a = 0.4, and KV = 3.0. (C) The volcano-shaped spot was generated with x0 = 1000, K = 0.0005, a = -0.4, KV = 3.0, and. Here, mean, median and mode are the arithmetic mean, the value of the middle term ranked in increasing order, and the value that occurs with the highest frequency, respectively.

