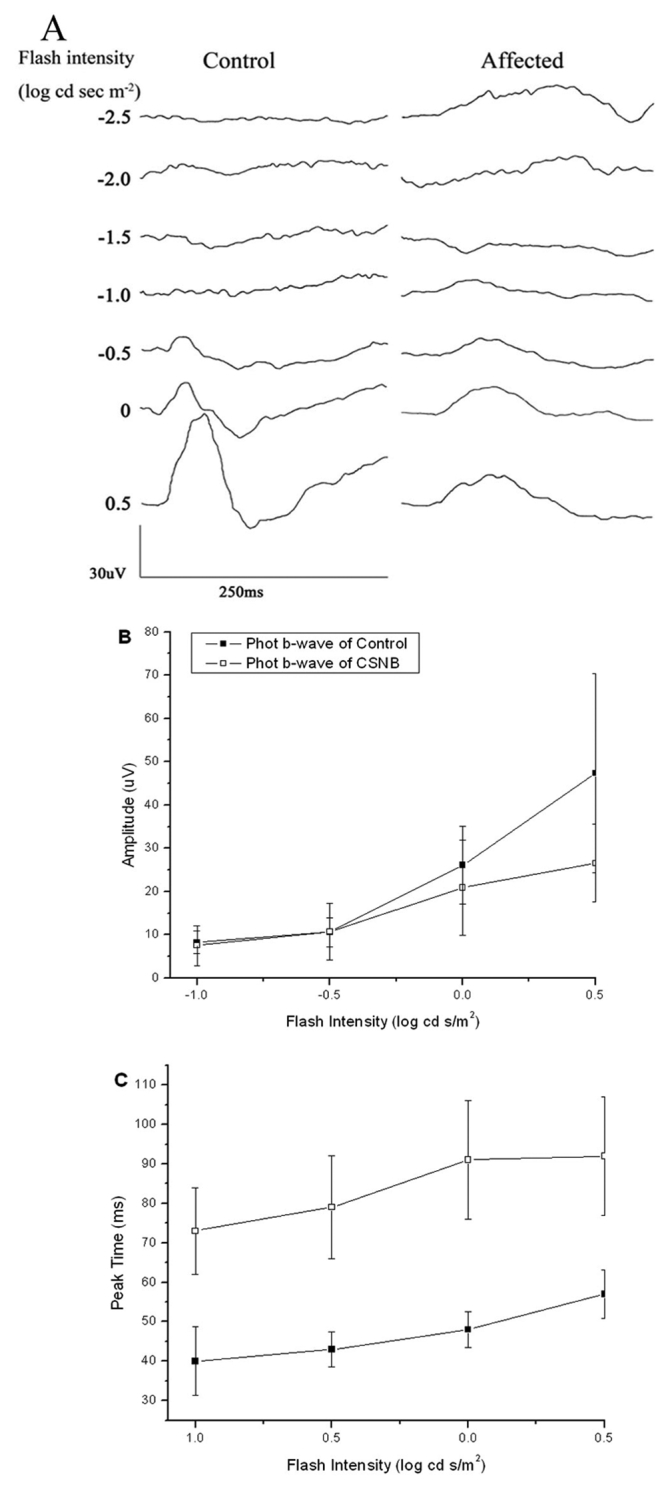
Figure 2.

Light-adapted electroretinograms. A: Comparison of light-adapted ERGs recorded from control and affected rats. B: Amplitude of light-adapted b-wave for control (filled square) and affected rats (open square). Data points indicate the mean±SEM response from ten 10-week-old rats. C: Peak time of light-adapted b-wave for control (filled square) and affected rats (open square). Data points indicate the mean±SEM response from ten 10-week-old rats.
