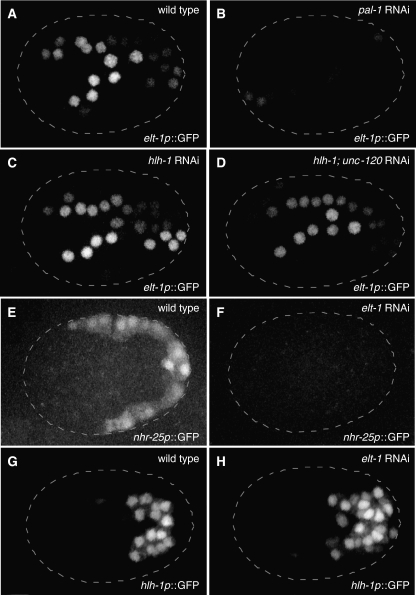
Figure 3.
Reporter gene analysis validates key inferred interactions. Two-dimensional projections of three-dimensional confocal microscopy images are shown for elt-1p∷GFP reporter gene 150 min after the 4-cell stage (22°C; ∼16C stage) for wild-type (A), pal-1 RNAi (B), hlh-1 RNAi (C), and hlh-1; unc-120 double RNAi (D). Similar projections are shown for an nhr-25p∷YFP reporter gene 200 min after the 4-cell stage (∼31C stage) for wild-type (E) and elt-1 RNAi (F), and for an hlh-1p∷YFP reporter gene at the same time for wild-type (G) and elt-1 RNAi (H). The number of cells expressing elt-1p∷GFP was not found to differ from wild-type (A) following hlh-1 RNAi (C) or hlh-1; unc120 RNAi (D) (data not shown). The number of cells expressing hlh-1p∷YFP was found to increase following elt-1 RNAi, from a wild-type average of 30 (n=5) to an elt-1 RNAi average of 42 (n=8), while 100% transformation from epidermal-to-muscle cell fate (between sister cells) should result in an increase of 16 hlh-1p∷YFP-positive cells.

