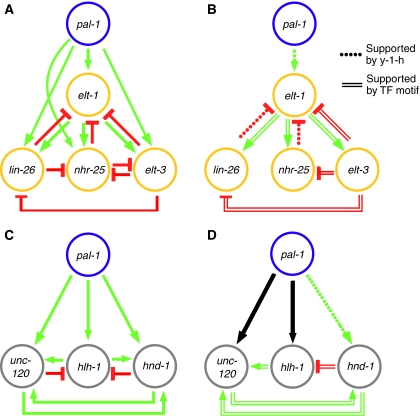
Figure 4.
Inference of cell type-specific regulatory interactions. A network representation of the perturbation-expression data is presented for the epidermal (A) and muscle (C) TFs. Each edge or arrow represents an inferred regulatory interaction (Figure 2, fold-difference >1.5, though most are >2), where decrease and increase in mRNA expression following RNAi is interpreted as activation (green) and repression (red), respectively. In the graphs in panels B and D, the red and green edges are those supported by either a yeast one-hybrid interaction (Figure 2, Supplementary Figure 2) or the presence of a significant number of putative TF-binding sites in the inferred target promoter region (Table I); the black arrows correspond to edges supported by microarray and reported genetic data, but not supported by either yeast one-hybrid or presence of putative TF-binding sites. Although none of these motifs has been validated as a functional cis-regulatory binding site by mutational analysis or otherwise, nor have the yeast one-hybrid interactions been confirmed in vivo, all are consistent with the topologies inferred for the epidermal and muscle modules, and they provide hypotheses regarding which regulatory relationships are likely to be direct.

