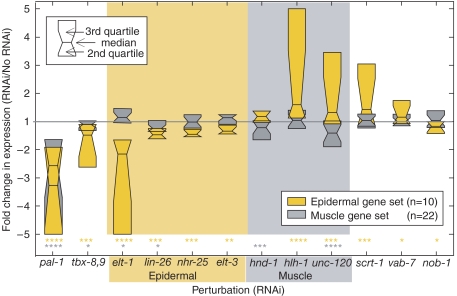
Figure 5.
The muscle and epidermal modules are differentially sensitive to perturbation and mutually repress each other. The effects of RNAi on epidermal- and muscle-specific gene sets are presented as quartile boxplots. For clarity, only median (horizontal line) and two quartiles of each distribution are shown. Effects greater than fivefold are trimmed to fivefold. P-values (see Experimental Procedures) of the deviation of the mean from the expected are indicated below the plots: *P⩽0.05; **P⩽10−2; ***P⩽10−3; ****P⩽10−4. As in Figure 2, the time point with the largest fold effect was selected.

