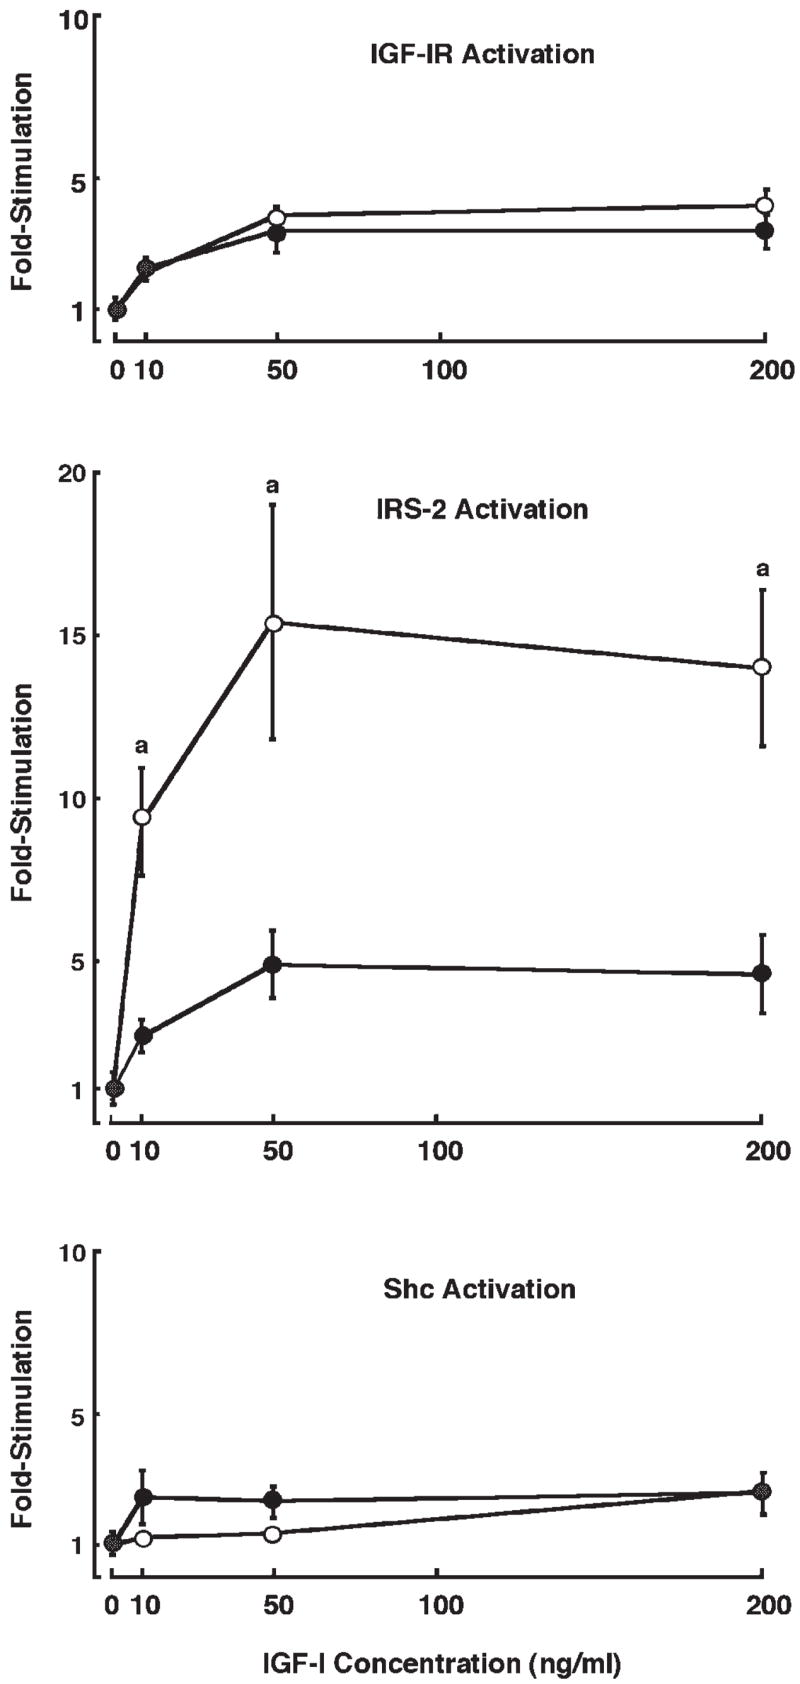
Fig. 9.

Magnitude of IGF-I-induced tyrosine phosphorylation of IGF-IR, IRS-2, and Shc in IRS-1+/+ (●) and IRS-1−/− (○) myofibroblasts. Intestinal myofibroblasts from IRS-1+/+ and IRS-1−/− mice were serum starved and were treated with IGF-I at different doses. Cell extracts were immunoprecipitated with antibodies against IGF-IR, IRS-2, or Shc and were immunoblotted with anti-phosphotyrosine antibodies or antibodies to total protein. Data points represent fold increases in tyrosine-phosphorylated protein vs. zero dose of IGF-I. Each data point represents a mean ± SE; n ≥ 4 independent experiments. aP < 0.05 in IRS-1−/− cells vs. IRS-1+/+ cells.
