
Figure 3.
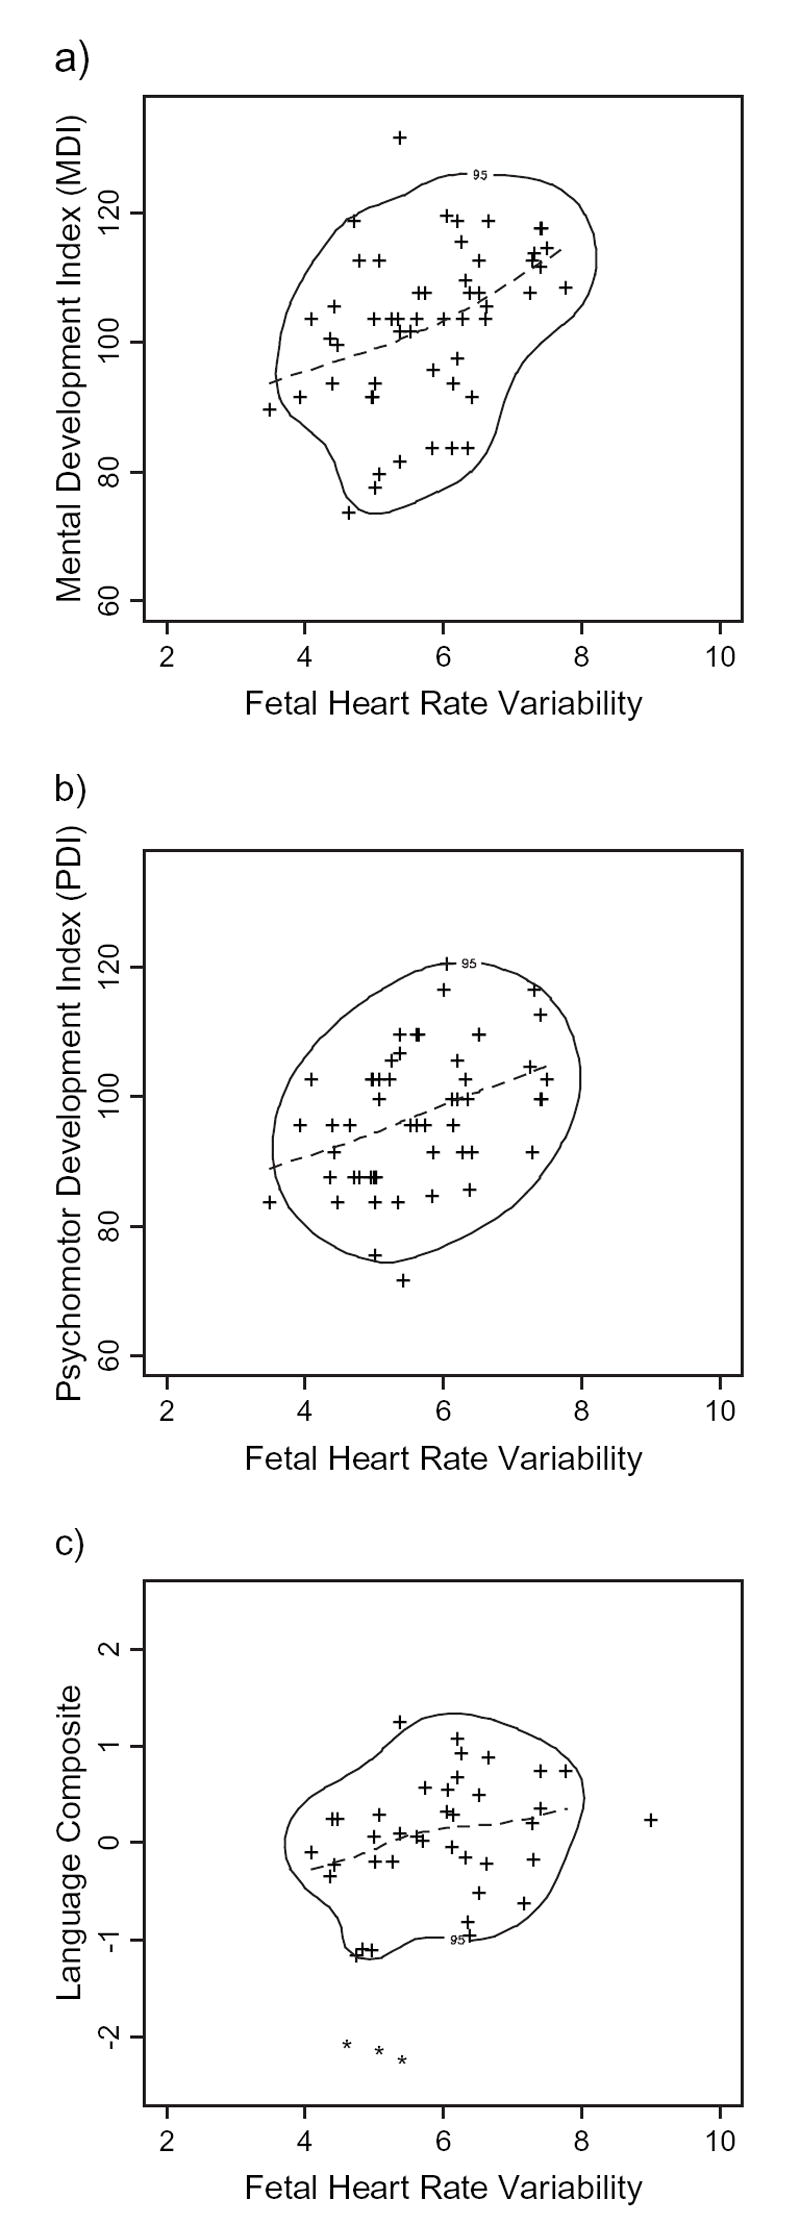
Nonparametric modeling of associations between fetal heart rate variability at 36 weeks gestation and child (a) Mental Development Index, (b) Psychomotor Development Index, and (c) language composite scores. Individual data points represent the estimated values generated by the fitted cubic smoothing spline across each individual fetal trajectory from 20 through 38 weeks gestation. Dotted lines represent fitted cubic smoothing spline, with 3 df for the sample as a group. The solid line surrounding most data points is the estimated 95% coverage region of the joint distribution of fetal predictor and child outcomes.