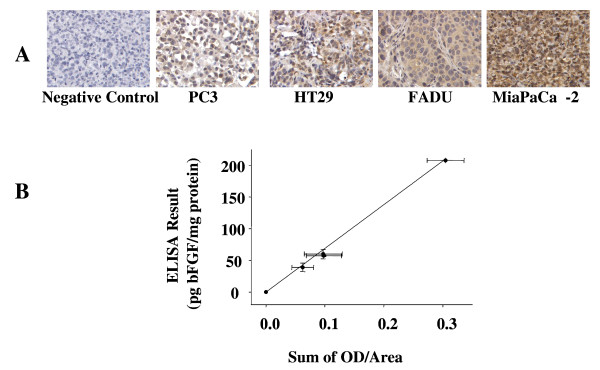
Figure 2.
bFGF standard curve. (A) Staining of bFGF (brown color) in PC3, HT29, FaDu, and MiaPaCa-2 tumors. Counter-stained with hematoxylin (blue). 400× magnification. The corresponding respective bFGF levels measured using ELISA were 39.0, 57.3, 60.0, and 208 pg/mg total protein. Negative control: MiaPaCa-2 tumor stained with nonspecific, IgG antibody. (B) bFGF standard curve (y = 690.5x; r2 = 0.996, p < 0.001). Mean ± Standard deviations.

