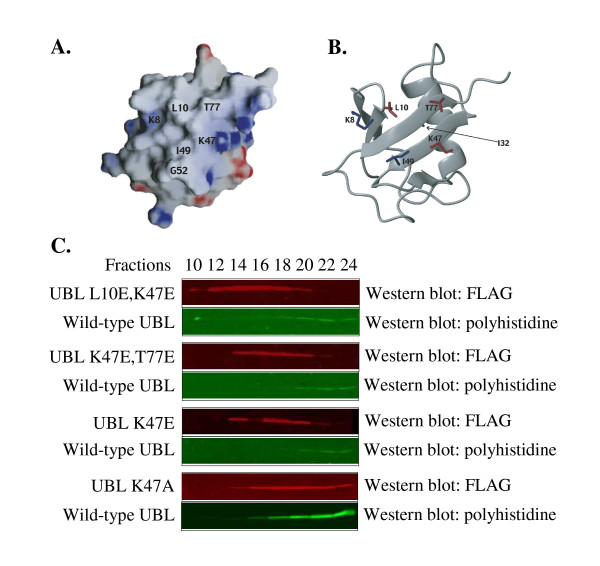
Figure 1.
Glutamic acid mutations in the UBL domain reduce binding to the UBA domains. (A) The electrostatic potential is mapped onto the surface diagram of the UBL domain of HHR23A. Positive and negative charges are indicated by blue and red respectively. GRASP was used to generate the surface diagram, using the parameters -25.4 to -12.7 and 25.4 to 12.7 kT to generate the surface potentials. (B) The ribbon diagram of the UBL domain of HHR23A was generated with MOLMOL [37], using reported UBL domain coordinates for HHR23A. (C) Equal amounts of wild-type UBL-His and mutated UBL-FLAG were loaded onto a GST-HHR23A~ΔUBL column. The column was developed with PBS and fractions were collected for analysis by Western blotting, using antibodies against each epitope tag. Visualization of the proteins was performed with LI-COR's Odyssey Imaging System.

