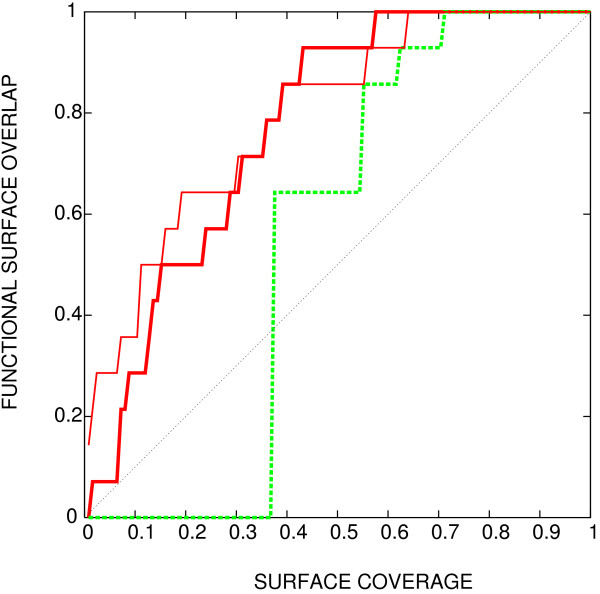
Figure 1.
Methods comparison, using rabphilin-3a as an example. The ability of three different methods to detect the interacting surface of the small G protein rab3a with the effector domain of rabphilin-3a (PDB [27] identifier 1zbd, chain A). Horizontal axis: fraction of surface appearing among the top scoring residues (surface coverage). Vertical axis: fraction of interface detected. Thin red line: rate4site; green dashed line: column entropy; thick red line: joint entropy with BLOSUM background frequency, described in the text.

