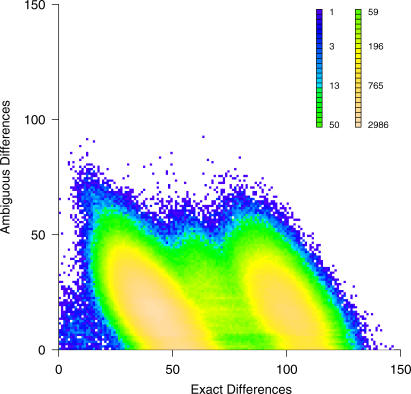
Figure 1. Distribution of Genetic Distance Among All Pairwise Comparisons of 2,126 Patient-Derived HIV Sequences.
Key indicates the number of comparisons for each datapoint by colour. Sequences were compared at all 499 third-base sites and recorded for an exact difference or an ambiguous difference (see text for details). Two major peaks reflect within subtype (30–60 differences) and between subtype (100–110 differences) comparisons, respectively. The third smaller region of density close to the origin identifies patients with at least one other closely related sequence in the dataset.

